
Eric Sepanek
SBC Founder
Eric Sepanek is the founder of Scottsdale Bullion & Coin, established in 2011. With extensive experience in the precious metals industry, he is dedicated to educating Americans on the wealth preservation power of gold and silver.

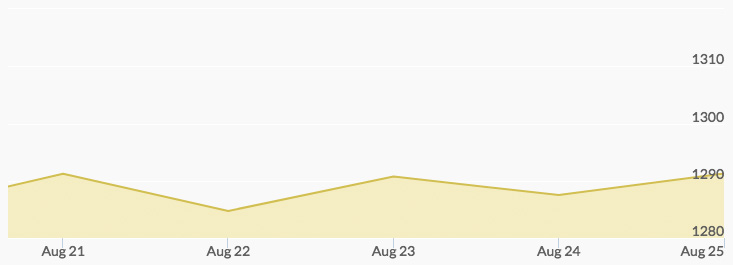
The price of gold saw a strong opening on Monday of $1,292.04. Bidding was up nearly a dollar by noon, but light selling produced a Monday closing quote of $1,290.76. The gold price chart reported a Tuesday opening of $1,285.93, which light selling took to $1,284.02 by the close. However, steady buying in the aftermarket took the price to $1,289 before the opening bid of $1,287.42 on Wednesday morning. More support moved that price to a close for the day of $1,290.78. The Thursday opening came in just pennies off at $1,289.17 and light trading during the day took the close to $1,285.98. Aftermarket selling produced a lower opening of $1,280.87 on Friday, but steady support took the price back to a close for the week of $1,291.20, off less than a dollar for the five days of trading.
The market showed support last week for the yellow metal despite a minor tapering off of purchases while participants awaited the Fed symposium and speeches in Jackson Hole, Wyoming. 1 This reflected long-term interest in gold while short-term speculators continued to wait and watch for more definitive market indicators.
However, the early results from that meeting and the speeches from Janet Yellen and Mario Draghi indicate a continued dovish position from the Fed relative to further interest rate increases. That reading caused early additions to bullish positions by major players, and the step-up in volume of trading showed a number of funds were net long in both gold and silver. Some early indications are that gold will hit a high for 2017 in the coming months. The developing hurricane in the Gulf, with its potential impact on energy costs, may also be a market factor.
This week’s U.S. Employment report on Friday will be important for moving short-term sentiments. The details of the non-farm data and several other releases during the week may affect views on the strength of the labor market and inflation.