
Todd Graf
Precious Metals Advisor
Todd Graf is a seasoned Precious Metals Advisor at Scottsdale Bullion & Coin. He has a decade-long career in finance, previously at Morgan Stanley and Vanguard. He is Series 7 licensed and has extensive experience in traditional and defensive assets, providing clients with solid investment strategies.
Even a month after the Federal Reserve’s decision, the rate cut remains a hot topic among investors and analysts. This aggressive move is more than just a one-off fiscal decision; it signals the start of a significant shift in monetary policy. The transition from tightening to a renewed cycle of quantitative easing (QE) is expected to weigh heavily on an economy that may not be as robust as initially thought.
In this week’s The Gold Spot, Precious Metals Advisors Todd Graff and Damian White dive into the challenges facing the Fed, whether the interest rate cuts were made prematurely, and the three indicators hinting that stagflation could be on the horizon.
All Assets Rising
Over the past few months, a broad spectrum of asset classes, including gold, the stock market, and Bitcoin, have hit record highs. Notably, many of these assets tend to have inverse price action. The fact that they’re all going up simultaneously suggests underlying economic instability and the potential for a major correction. The Fed’s policies have directly contributed to this “everything bubble,” as all assets receive a boost from easy-money policies, which have pumped capital into the economy, inevitably inflating investments across the board.
Premature Rate Cuts?
A slew of positive economic data, including strong job numbers and steadying inflation, indicated that the Fed’s aggressively high interest rates might have achieved the soft-landing Americans were promised. On that positive note, the Fed decided to change course with a strong half-point rate cut, ushering in a rate cut cycle that could last several years. Unfortunately, the trend of positive economic indicators hasn’t continued. Not long after the Fed’s aggressive rate cut launch, some negative data points started to muddy the fiscal policy waters. Now, a series of alarming signals have many investors wondering if rate cuts came too early.
Entrenched Inflation
Right after the government was ready to celebrate the victory against inflation, the Consumer Price Index (CPI) and Producer Price Index (PPI) rose. CPI numbers increased 0.3% in September, highlighting the elevated prices Americans are still paying for essentials. The PPI is up 1.76% from a year ago, which suggests that producers are incurring higher operational costs, further driving up consumer goods.
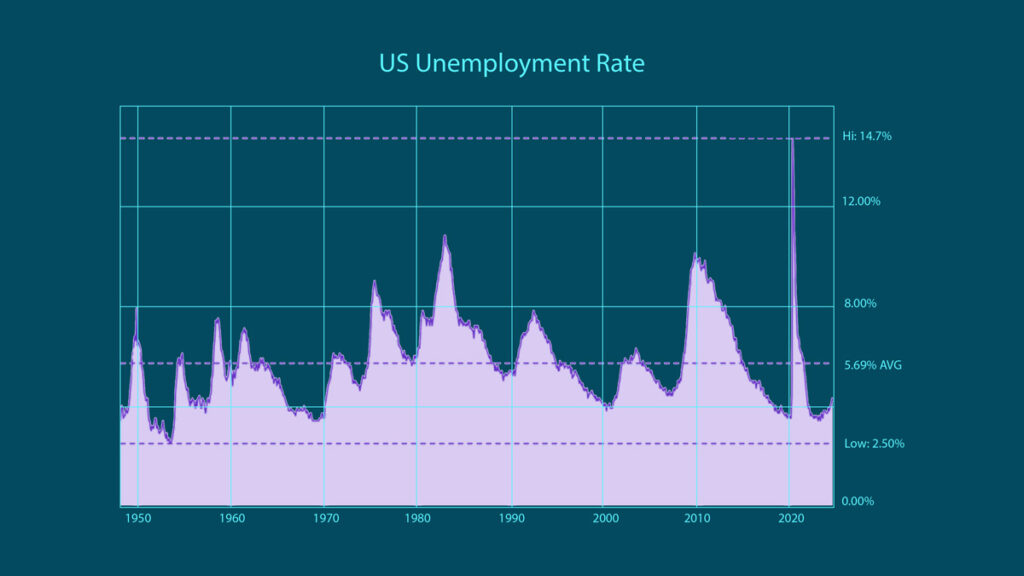
Rising Unemployment Numbers
A recent elevation in unemployment filings throws another layer of concern into the mix as a number of challenges, including disruptive strikes, widespread natural disasters, and high-profile layoffs, weigh on the job market. According to reports, the number of people receiving jobless benefits jumped by 42,000, totaling 1.861 million in September.
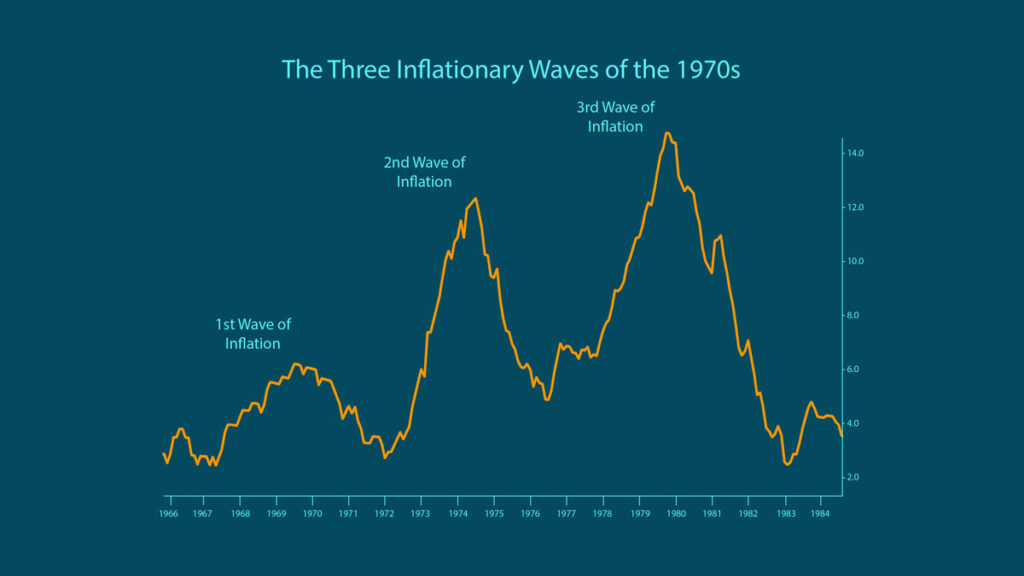
Volatile Interest Rate Policy
A third troubling economic signal comes from the 1970s fight against entrenched inflation, where the Fed engaged in a volatile interest rate policy. Rapid and aggressive swings between rate cuts and rate hikes resulted in three progressively larger inflationary waves. Today, the Fed is balking at its intended aggressive rate cut policy due to mixed results – an eerie indication of a potential repeat of the volatile ’70s rate practice.
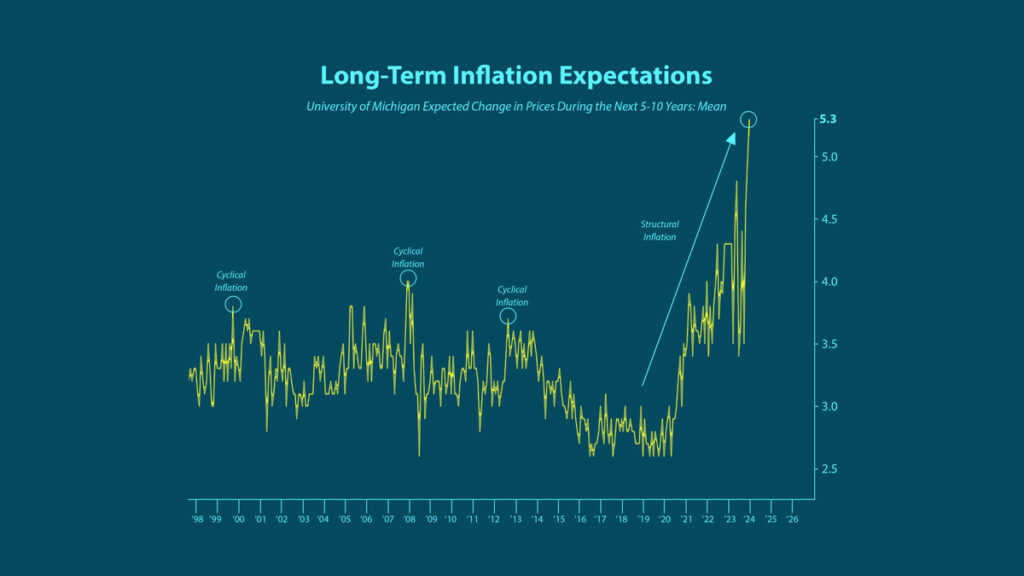
Stagflation Fears Rise
The combination of stubborn inflation, economic slowdown, and job market troubles are whipping up fears of stagflation. The University of Michigan recently released a report surrounding long-term inflation expectations, suggesting cyclical inflation could turn into structural inflation in the near future, furthering fears of a stagflationary environment.
If we’re really seeing inflation start to rise again while the Fed is cutting rates, this would ultimately be putting fuel on the fire.–
Stagflation: Where Gold Performs Best
Stagflation is undeniably bad news for the overall economy, but historically, it’s the environment where gold truly excels. The last significant period of stagflation in the U.S. occurred throughout much of the 1970s, driven by the Middle East oil crisis and the collapse of the Bretton Woods Agreement. This triggered nearly a decade of rampant inflation.
During that time, gold prices soared from around an average of $77 an ounce1 in the early 1970s to a peak of $678 an ounce2 by 1980 – an impressive 780% gain! While no one can predict precisely how high gold prices could climb if stagflation reemerges today, history strongly suggests that this economic setting is when the yellow metal performs at its best.
In a stagflationary environment, gold performs the best.–
Be Proactive and Safeguard Your Assets Now
With these key economic signals continuing to worsen, investors must be proactive about preserving their wealth. The Fed has proven time and time again, through its marriage to Modern Monetary Theory (MMT), that it is incapable and unwilling to solve the debt-laden issues facing the economy.
“Trusting the Federal Reserve to be able to make the changes to help is a bad strategy. People need to safeguard their assets so they don’t lose them in the coming financial problems.”
Todd Graf
Precious Metals Advisor

Gold has already put on a record-setting rally throughout 2024 in response to rising economic uncertainty and volatility. As experts continue to raise their price forecasts, it seems the yellow metal will only move higher. In fact, a recent survey of major bullion players at a London Bullion Market Association event indicates the price of gold is expected to increase by another 10% within a year.
Taking steps now to secure your wealth with physical gold and silver can ensure you’re in a better position when the looming storm hits.
Question or Comments?
If you have any questions about today’s topics or want to see us discuss something specific in a future The Gold Spot episode, please add them here.
Comment
Questions or Comments?
"*" indicates required fields